Posted by
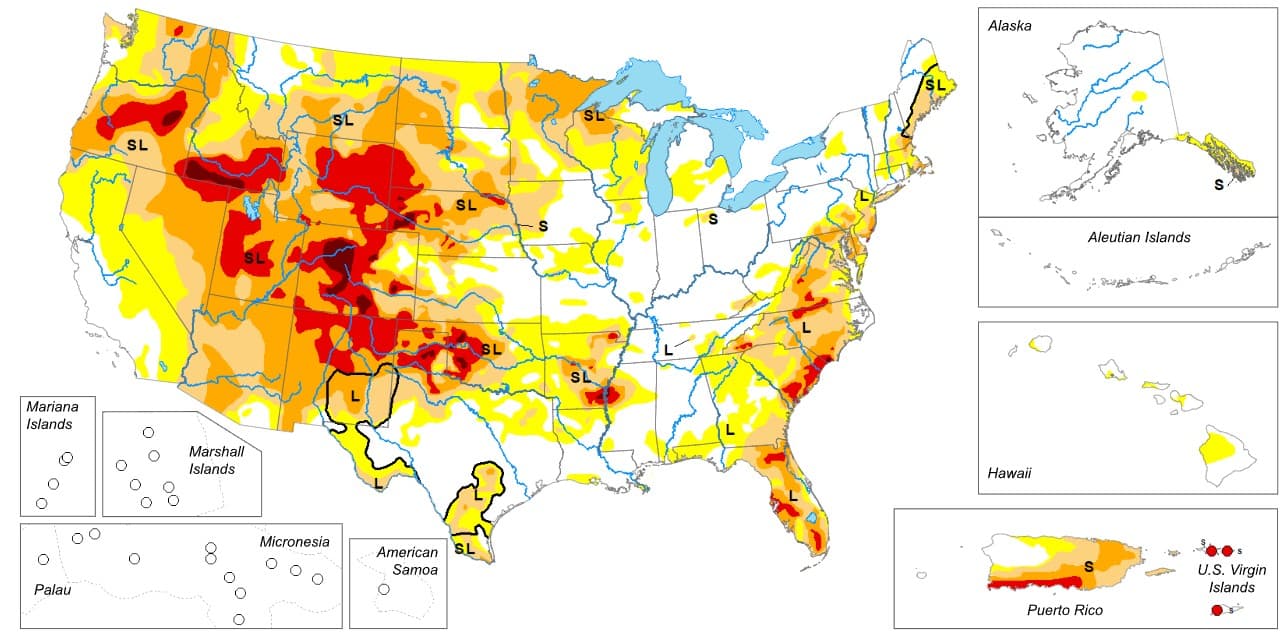
Explore weekly and historical maps of drought conditions across the US, alongside regional summaries of drought conditions, with the US Drought Monitor.
Findings
Additional insights we found via US Drought Monitor
The USDM releases a new map every Thursday at 8:30 am Eastern based on a data cutoff of the previous Tuesday morning.
On the USDM, drought intensity is indicated by a color-coded system, from white regions experiencing no drought to dark red regions experiencing exceptional drought.
On the USDM map, drought impacts are indicated by the letters "S" and "L," which denote short-term impacts lasting less than six months and long-term impacts lasting more than six months, respectively.
Similar Posts
Showing 1440 posts similar to “Explore weekly and historical maps of drought conditions across the US, alongside regional summaries of drought conditions, with the US Drought Monitor.”
You've reached the end.